Liuhuaying Yang joined the Complexity Science Hub’s visualization team in September 2021. She received her Master of Fine Arts’ degree in information and data visualization from Northeastern University in Boston in 2018. Her expertise is in design and front-end development of interactive data visualizations on the interface of academic research and applications.
Liuhuaying has worked with the Senseable City Lab at the Massachusetts Institute of Technology (MIT) and SMART FM in Singapore as a data visualization specialist and SPH Lianhe Zaobao in Singapore as a data visualization designer for interactive data journalism projects. Previously, she interned in the data strategy group at the Massachusetts Bay Transportation Agency.
Liuhuaying’s work is driven by a desire to use data visualization to talk about important social issues. Beside an interest in efficient ways to use data visualization to communicate complex topics, she believes in using an artistic and humanistic approach to engage wide audiences. Her work has been awarded the first prize in the 2019 TRB Innovations in Transit Performance Measurement Challenge and recently won first place in the interactive category of the World Dataviz Prize 2023.
Related
in review


Explore Austria’s zoonotic interactions with an interactive visualization, introducing the ‘zoonotic web’ concept to describe animal-human-environment relationships.
Explore changes in job demand and labor frictions resulting from the transition to a net-zero emissions power system.
Take the challenges to become part of a multi-disciplinary team dedicated to visualizing the results of complexity science research.
Explore patterns in the ability of institutions and countries to attract and retain research talent across disciplines.
How do people travel to work in your city? Explore the model share data for over 800 cities in the world.
Which regions receive most attention from the Sustainable Development Goals (SDGs) research, and which regions are more studying others than self?
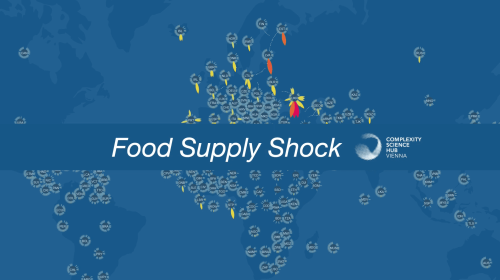
Explore effects of global supply disruptions via interactive visualizations and maps.
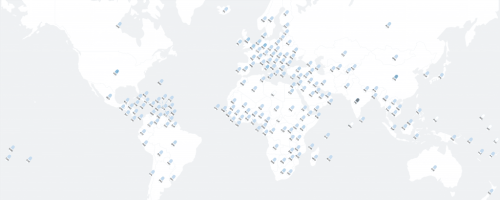
Explore how vulnerable the antibiotics supply in more than 100 countries is with respect to production disruptions in any of the other countries.
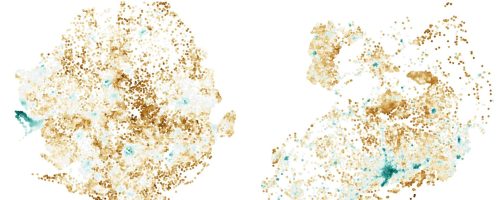
Explore the inferred wealth in Sierra Leone and Uganda from multiple machine learning models
Explore the potential green products in Austria in product space.
Explore the overlapping communities of diagnoses in the multilayer comorbidity network.
Explore how algorithms work on different types of networks, starting from explaning the essential components and leading to a more advanced explorable dashboard.
Explore which food products are lost and which countries are affected most severely when a specific supplier stops to produce a single food product.
Learn intricate social polarization in multipolar systems through scrollytelling in digestible bits and explore advanced network models, including a real-world scenario with four poles (3D opinion space) of the Spanish General Elections of 2015.
Get intuitive insights into specific aspects of SARS-CoV-2 events in animals at-a-glance.
Explore the resilience of the Austrian healthcare system using agent based simulation
Twelve Facts about the Relation Between the Economies of Ukraine, Russia, and the EU
Explore the effects of international sanctions against Russia in response to the invasion of Ukraine.
Show direct and indirect effects of a 100% supply shock of maize and sunflower seed oil on a stylized world map.
Play a game to learn some insights from the sport funding transparency research
Get an overview of Austrian sport clubs, how they are funded and how many children they train.
Signup
| Cookie | Duration | Description |
|---|---|---|
| cookielawinfo-checkbox-analytics | 1 year | Set by the GDPR Cookie Consent plugin, this cookie records the user consent for the cookies in the "Analytics" category. |
| cookielawinfo-checkbox-functional | 1 year | The GDPR Cookie Consent plugin sets the cookie to record the user consent for the cookies in the category "Functional". |
| cookielawinfo-checkbox-necessary | 1 year | Set by the GDPR Cookie Consent plugin, this cookie records the user consent for the cookies in the "Necessary" category. |
| CookieLawInfoConsent | 1 year | CookieYes sets this cookie to record the default button state of the corresponding category and the status of CCPA. It works only in coordination with the primary cookie. |
| PHPSESSID | session | This cookie is native to PHP applications. The cookie stores and identifies a user's unique session ID to manage user sessions on the website. The cookie is a session cookie and will be deleted when all the browser windows are closed. |
| viewed_cookie_policy | 1 year | The GDPR Cookie Consent plugin sets the cookie to store whether or not the user has consented to use cookies. It does not store any personal data. |
| Cookie | Duration | Description |
|---|---|---|
| mec_cart | 1 month | Provides functionality for our ticket shop |
| VISITOR_INFO1_LIVE | 6 months | YouTube sets this cookie to measure bandwidth, determining whether the user gets the new or old player interface. |
| VISITOR_PRIVACY_METADATA | 6 months | YouTube sets this cookie to store the user's cookie consent state for the current domain. |
| YSC | session | Youtube sets this cookie to track the views of embedded videos on Youtube pages. |
| yt-remote-connected-devices | never | YouTube sets this cookie to store the user's video preferences using embedded YouTube videos. |
| yt-remote-device-id | never | YouTube sets this cookie to store the user's video preferences using embedded YouTube videos. |
| yt.innertube::nextId | never | YouTube sets this cookie to register a unique ID to store data on what videos from YouTube the user has seen. |
| yt.innertube::requests | never | YouTube sets this cookie to register a unique ID to store data on what videos from YouTube the user has seen. |
| Cookie | Duration | Description |
|---|---|---|
| _ga | 1 year | Google Analytics sets this cookie to calculate visitor, session and campaign data and track site usage for the site's analytics report. The cookie stores information anonymously and assigns a randomly generated number to recognise unique visitors. |
| _ga_* | 1 year | Google Analytics sets this cookie to store and count page views. |
| _gat_gtag_UA_* | 1 min | Google Analytics sets this cookie to store a unique user ID. |
| _gid | 1 day | Google Analytics sets this cookie to store information on how visitors use a website while also creating an analytics report of the website's performance. Some of the collected data includes the number of visitors, their source, and the pages they visit anonymously. |