Teaching Material
Poverty Maps: Tracking inequality of wealth
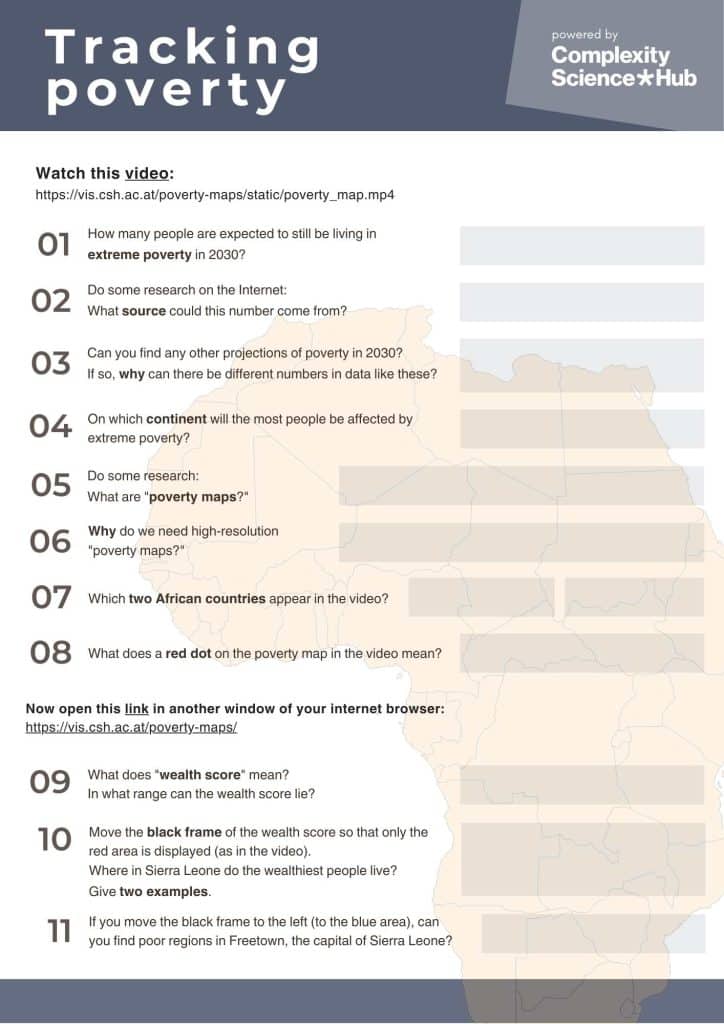
Poverty Maps are detailed maps where we can see how poverty and inequality are distributed in a country. Students explore Sierra Leone and Uganda on their own. With the interactive visualization, they learn how poverty is distributed, what the differences are, and what can be done. An explanatory video (in English) guides them through the material.
Duration: 2+ lessons
Subjects: geography, economics, political education, digital education.
Age: from 12 years
